compute-geometry
compute-geometry is a research-focused computational geometry library for Python. It pairs a small set of validated geometric primitives with classical algorithms and a cohesive visualization layer, so you can move from raw coordinates to a publication-ready figure in just a few lines.
The library is intentionally compact and composable. Primitives validate their own inputs, algorithms accept plain points or segments, and every algorithm has a matching one-call plotting helper — the three layers are designed to be used together or independently.
Installation
compute-geometry requires Python 3.12+ and is imported as cgeom:
uv add compute-geometry # or: pip install compute-geometry
See the installation guide for building from source and for the documentation toolchain.
The three layers
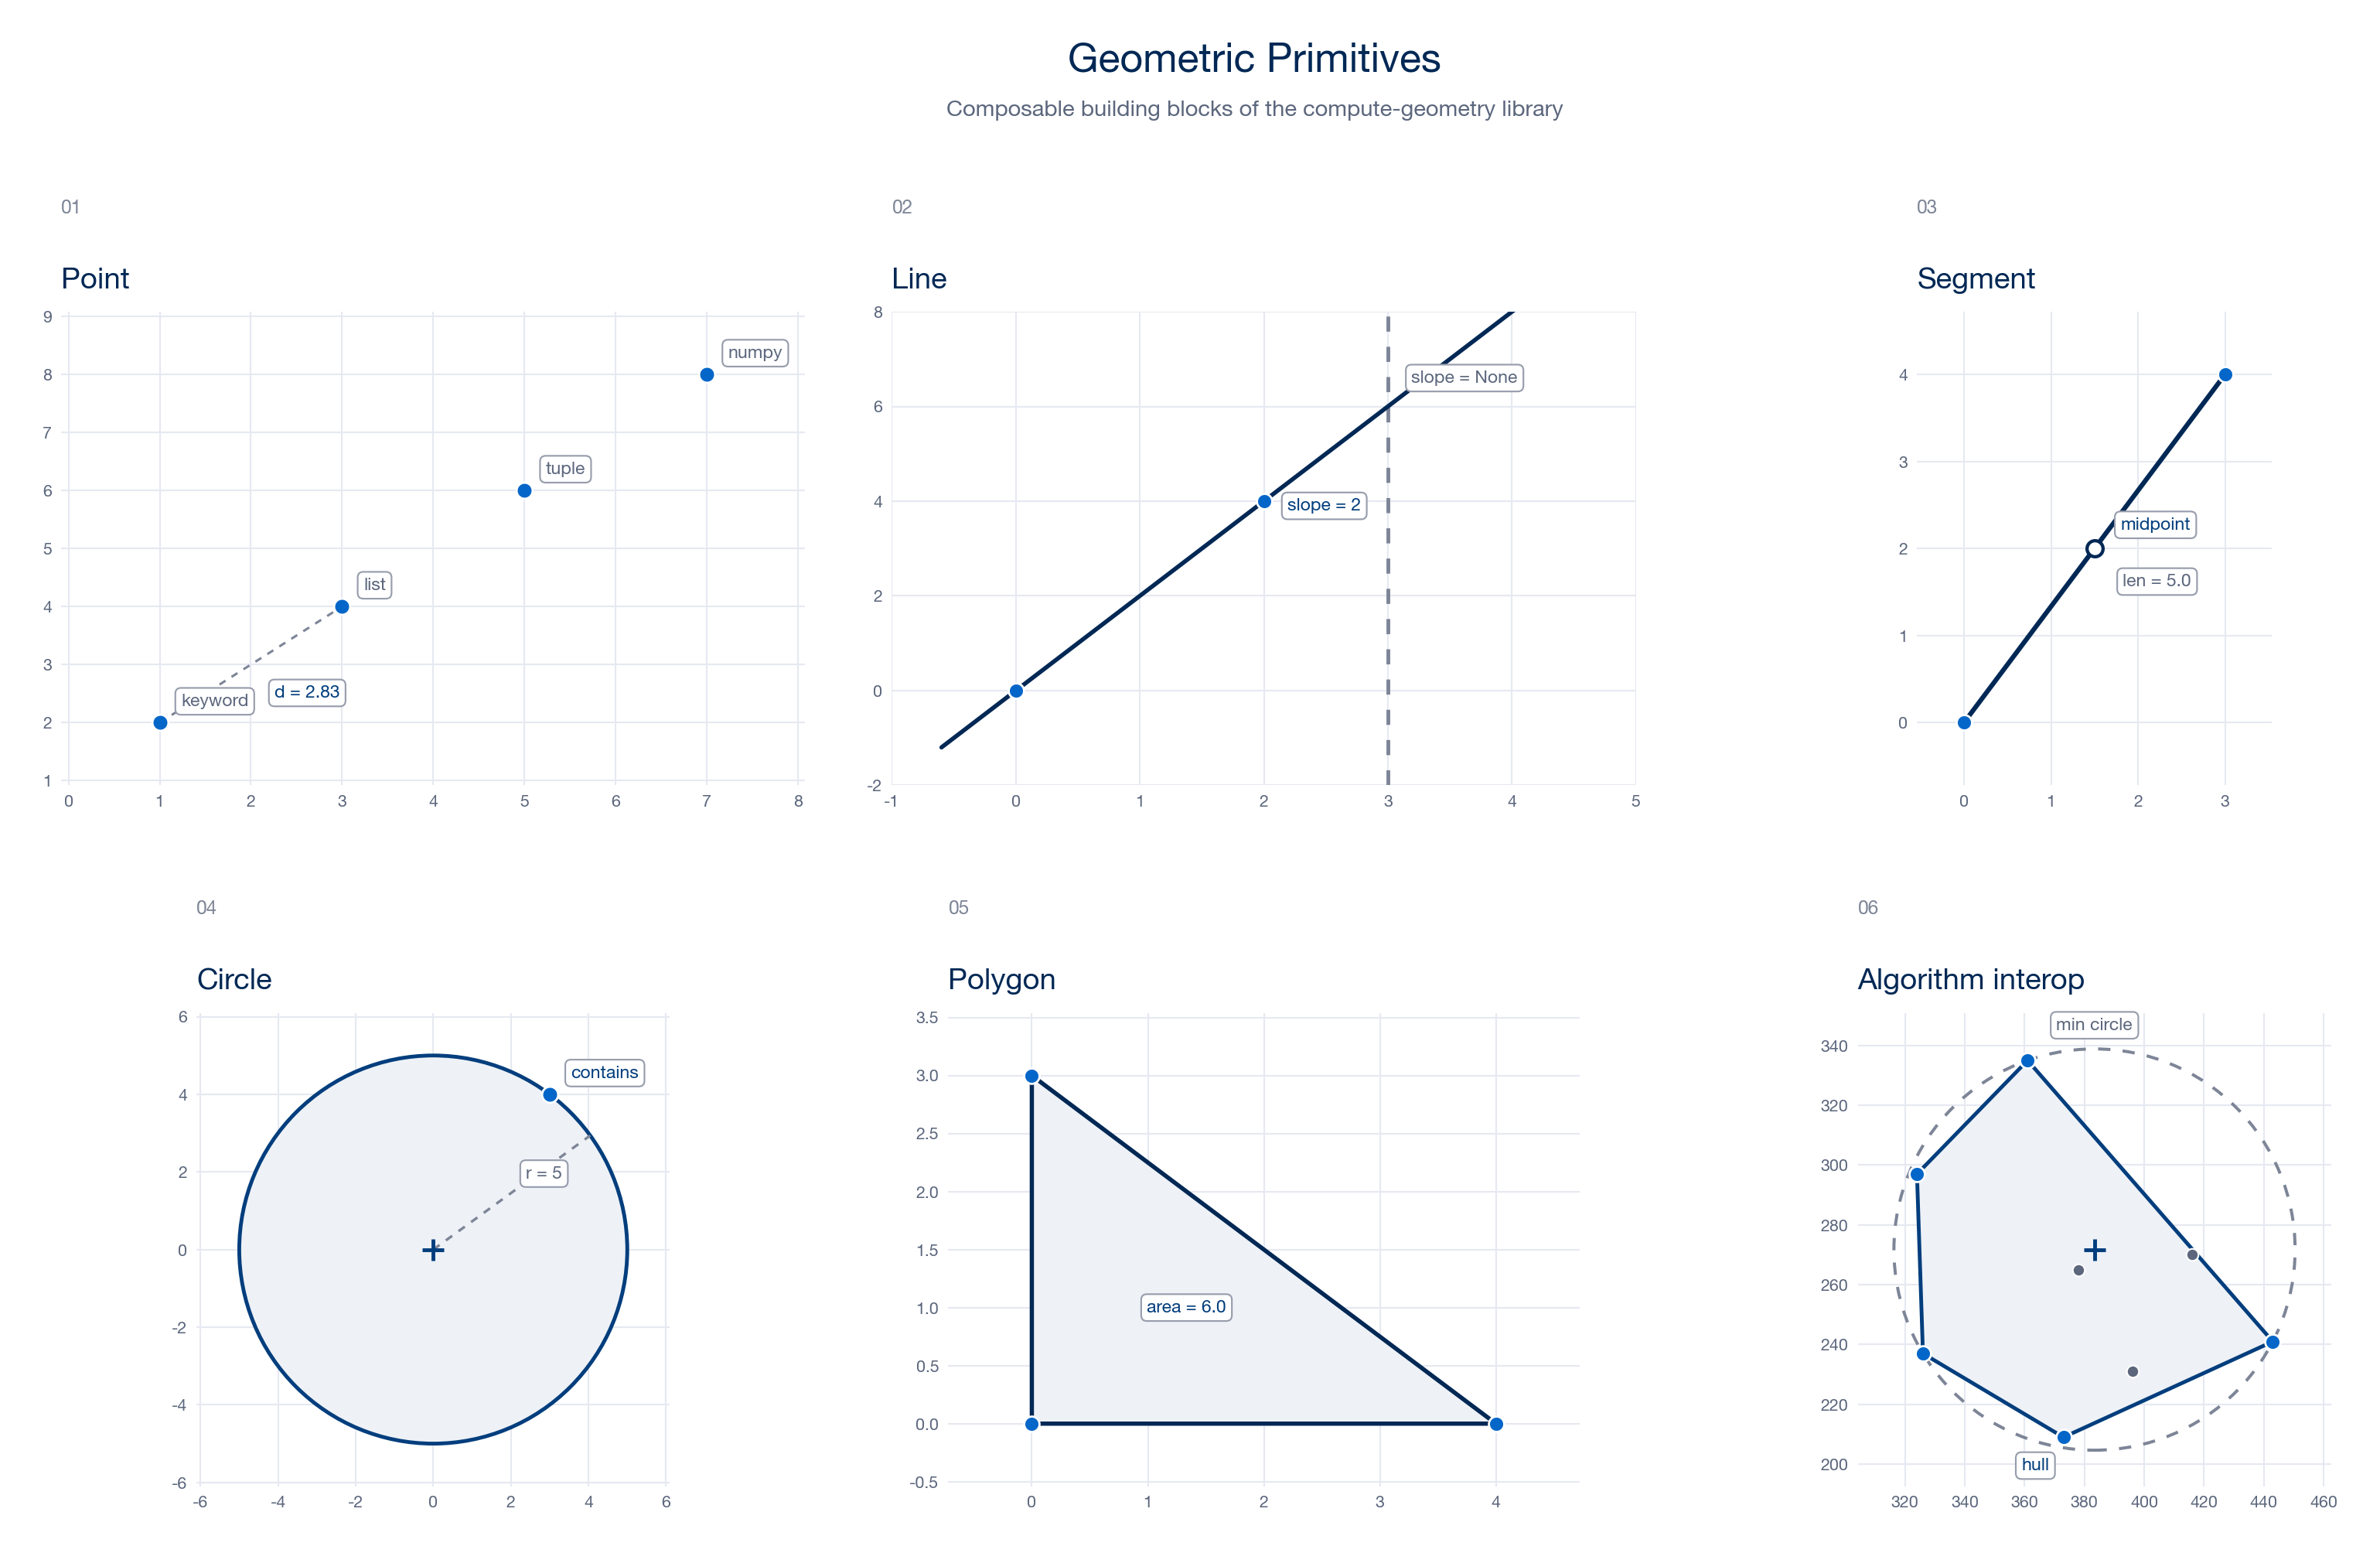
Primitives. Point, Line, Segment, Circle, and Polygon are
immutable, Pydantic-validated models. They accept flexible construction forms —
keyword arguments, lists, tuples, or NumPy arrays — and reject malformed input
at construction time, so downstream code never sees an invalid shape.
Algorithms. The cgeom.algorithms module bundles the classics: convex hull,
minimum enclosing circle, Delaunay triangulation, Voronoi diagrams, polygon
triangulation, and segment intersection. Each is a small class that takes a set
of points or segments and exposes its result through clearly named methods.
Visualization. The cgeom.visualization module provides one Matplotlib
helper per algorithm. They share a clean navy-and-blue palette and sensible
defaults, so a single call turns an algorithm’s output into a finished figure.
A first look
Build a Voronoi diagram from a set of sites and plot it:
import numpy as np
from cgeom.algorithms import VoronoiDiagram
from cgeom.visualization import plot_voronoi

points = np.loadtxt("examples/points1.txt")

voronoi = VoronoiDiagram(points)
cells = voronoi.build_voronoi_diagram()
plot_voronoi(voronoi, cells)
Where to next
Quickstart — the core workflow in one page: build, compute, plot.
Examples — a complete, runnable example and figure for every algorithm.
User guide — primitives, algorithms, and visualization in depth.
API reference — full signatures generated from the docstrings.